One of probably most difficult situations is a need for debugging in production environment.
After all you application and Windows traces cannot help you will have to debug in production. As long your application internal tracing mechanism is well designed, you will likely never
run into this problem. But what when this happen?
I had that situation few weeks ago. Application traces didn’t show any error and Windows Logs indicated that all works fine. Suddenly the application even didn’t start.
It was obvious that the problem is somewhere deep down in the system. Here is how I fixed it.
My idea was to enable IntelliTrace , without installing on Visual Studio in production.
IntelliTrace Trace is tool which is capable to run without of Visual Studio as so called Stand Alone IntelliTrace Collector.
To setup the environment and to start collecting of information we need to execute few steps.
1. Download IntelliTrace Collector
Before you start you have to download Stand Alone Collector . Collector is downloaded as an EXE file which should be saved to a folder of your choice.
I saved it in folder c:\Temp\intellitrace. So, this folder will be used/referenced in the rest of this article.
2. Expand CAB files
After download all files needs to be extracted from a three of many CAB files located in c:\Temp\intellitrace.
To do this I used following command:
c:\Temp\intellitrace>expand /f:* IntelliTraceCollection.cab c:\temp\intellitrace
3. Import required command lets for PowerShell
As next we need to import Power Shell command lets which are provided in assembly Microsoft.VisualStudio.IntelliTrace.PowerShell.dll, which was
extracted in the step above.
Import-Module "C:\temp\IntelliTrace\Microsoft.VisualStudio.IntelliTrace.PowerShell.dll"
If you get error like “… no valid module file …” navigate to "C:\temp\IntelliTrace and try following, navigate to c:\Temp\intellitrace
and execute following:
Import-Module .\Microsoft.VisualStudio.IntelliTrace.PowerShell.dll"
4. Start collecting information
Now we need to start collecting of information. In this case I was collecting form a web application which is running in IIS pool.
Start-IntelliTraceCollection "IIS APPPOOL\DefaultAppPool" "c:\temp\intellitrace\collection_plan.ASP.NET.default.xml" c:\temp\intellitrace\log
If this does not work, because the user who is running the pool has no permission to write in the log file you will get following error:
Start-IntelliTraceCollection "DefaultAppPool" "c:\temp\intellitrace\collection_plan.ASP.NET.default.xml" c:\temp\intellitrace\log
Start-IntelliTraceCollection : The following application pool requires write permissions to the output directory: "IIS
APPPOOL\DefaultAppPool", "C:\temp\intellitrace\log".
At line:1 char:1
+ Start-IntelliTraceCollection "DefaultAppPool" "c:\temp\intellitrace\collection_p ...
+ ~~~~~~~~~~~~~~~~~~~~~~~~~~~~~~~~~~~~~~~~~~~~~~~~~~~~~~~~~~~~~~~~~~~~~~~~~~~~~~~~
+ CategoryInfo : NotSpecified: (:) [Start-IntelliTraceCollection], InvalidOperationException
+ FullyQualifiedErrorId : System.InvalidOperationException,Microsoft.VisualStudio.IntelliTrace.PowerShell.StartInt
elliTraceCollectionCommand
In the URL above is described how to setup the permission in a proposed way. I do this rather the easy way by adding the write permission to the folder which should hold the LOG file.
5. Start Application
Then start your application if it is not running and execute the part which will run into the problem which you are analyzing. AFter you are sure that the problem was reproduced, look in the
folder c:\temp\intellitrace\log. There you will find the file iTrace. *which is not from Apple :))

6. Start Debugger
This file can be opened by Visual Studio Ultimate only! After VS starts historical debugger you might see following:
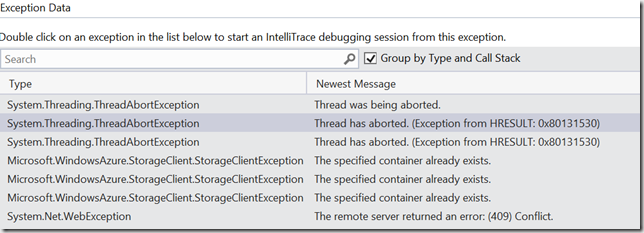
As you see some exceptions have been noticed above, but don’t be surprised if they are not related to your problem. I would rather recommend
to navigate below to Web Requests section. There you can find the request which possibly caused the error and start debugging
directly on the stack which is related to this request only.
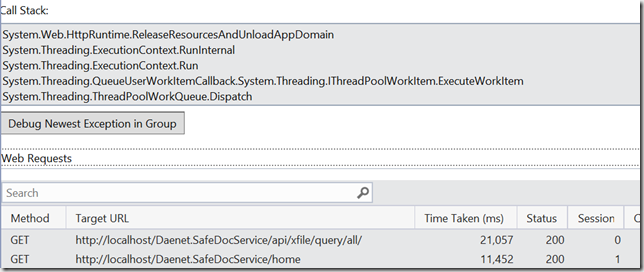
After you double-clicked on error you will get something like this:
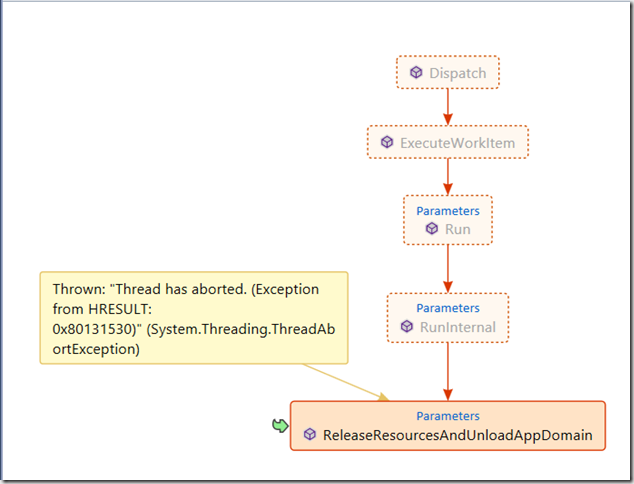
Do not wonder if you see graphical representation of stack which you do not know. But it is mostly helpful to figure out what caused the error.
7. Stop collecting data
At the end of debugging don’t forget to stop collecting of data.
Stop-IntelliTraceCollection
Debugging with IntelliTrace in Microsoft Azure
One of great features of Microsoft Azure Platform is a huge simplification of all steps described above. When you have deployed the application as a Cloud Service (PaaS)
the rich set of diagnostics features can be enabled by simply clicking the check-box. As you see on picture below I have enabled IntelliTrace and Remote Debugger.
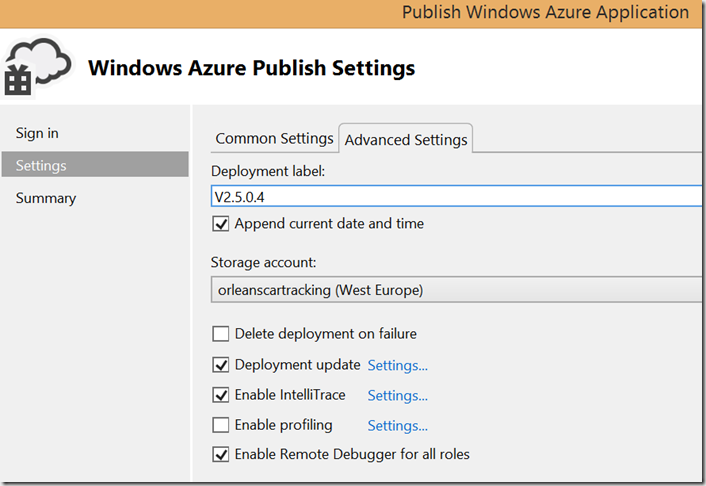
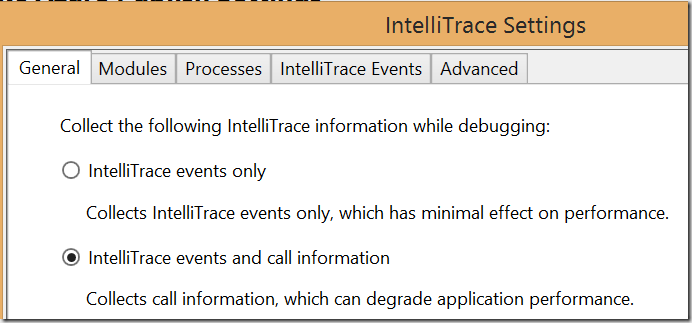
Enabling IntelliTrace deployment process of the service will perform all steps described above and more. By clicking on “Settings” you can configure many other settings.
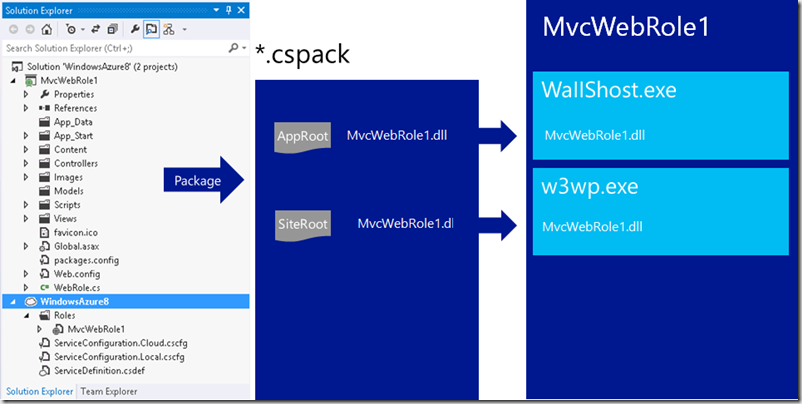
When deployed Web-Roles will semantically run in w3wp.exe and WallShost.exe processes. The Worker Role will run in WaWorkerHost.exe.
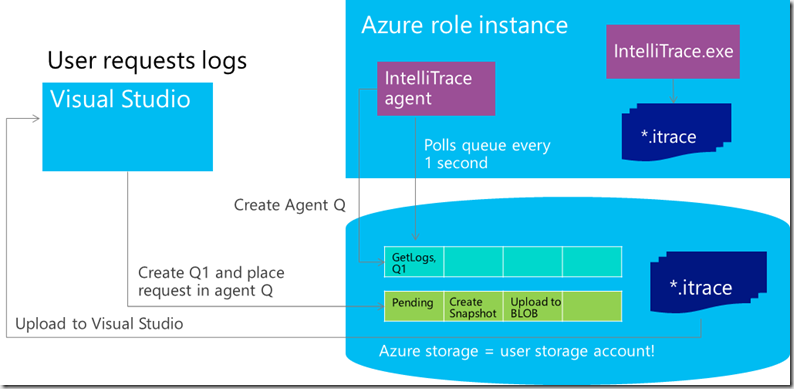
Next picture shows more or less the Infrastructure behind IntelliTrace on Cloud Service box. Additionally to IntelliTrace.exe which is responsible for collecting
of events, there is a IntelliTrace Agent. The later one coordinates transfer of iTrace files when they are required.
At this point it is important to know that Remote Debugger is a part of PaaS host infrastructure. It is much, much easier to deal with it than with usual Remote Debugger in On-Prem environment. More over enabling of IntelliTrace is obviously also simpler than working with IntelliTrace Collector described in this article. More about this can be found in Boris Great Session here and as video here.
Posted
Sep 30 2014, 08:22 PM
by
Damir Dobric