One of good Microsoft decisions was to try to align cloud technologies to traditional On-prem technologies. Especially Service Bus for Windows server was a product which
first implemented this strategic decision. But most partners and customer who host Service Bus on their own will figure out that such a complex system is not always easy to maintain.
The product is very robust one and works well. But sometimes there are situations when the system works, but somewhere deeply in detail some thing might hiddenly go wrong.
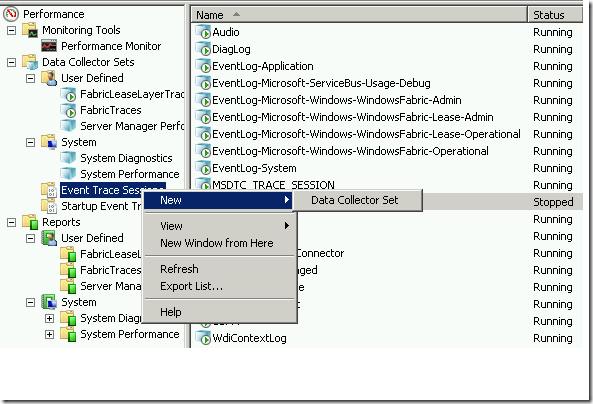
In such cases, the only way to dig under the hub is to enable Service Bus trace. To do that, first start performance monitor (perfmon.exe). Then navigate to “Event Trace Session” and create new “Data Collector Set”
as shown at the picture below.
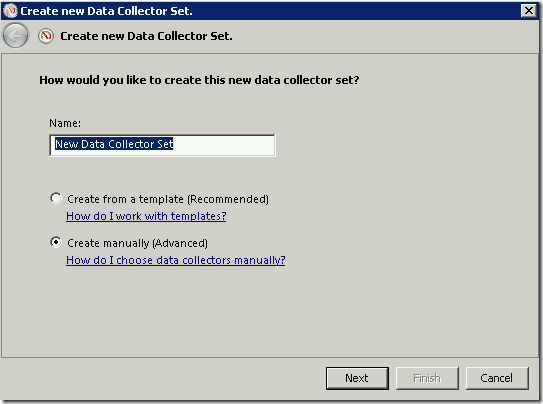
Enter some name for collector set and chose Create Manually (advanced):
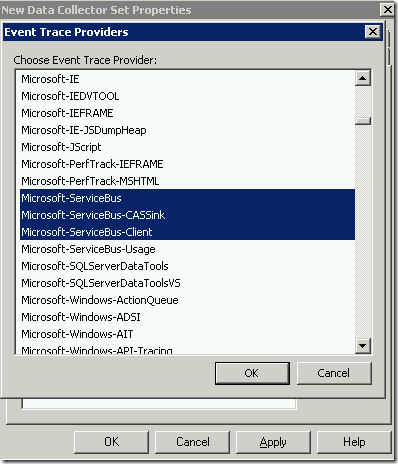
Scroll down and select following 3 ETW (Event Trace for Windows) providers. Please note that you do not have select always all three providers.
If you are tracing client side only chose client. In fact if you select all you will not do anything wrong. You only shell be more selective, because
every of these providers generate really lot of data. It can happen that you generate 50-100MB of traces in one minute only.
After selection of providers you do not have to change any of properties. It is everything already done.
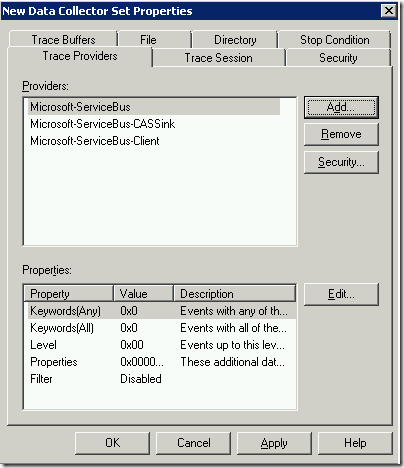
As next select the file where trace data will be saved.
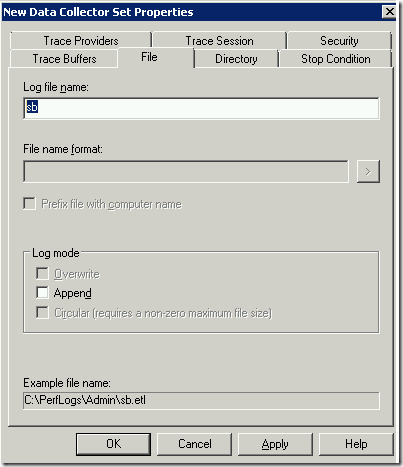
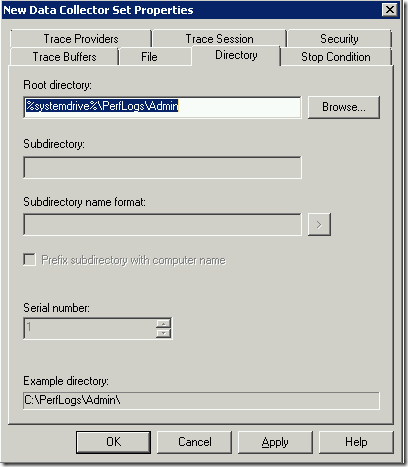
In the last step, you can open “Stop Condition” tab and select to stop tracing after the trace file has reached the size of for example 100MB.(Not shown at picture).
After file is created you will see it in the folder which you chosen in a step before. The file name contains the timestamp and .ETL extension.

Do not double-click on the file, because the Windows Performance Analyzer will be started. We want to open the file in Event Viewer and not in WPA.
Start first EventViewer and select “Open saved log”.
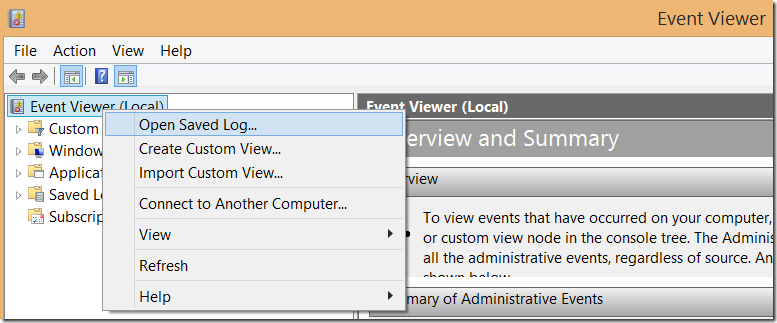
The create the new event log copy of this file (simply click on ‘OK’. This will convert ETL file into EVTX file, which can be opened by EventViewer.
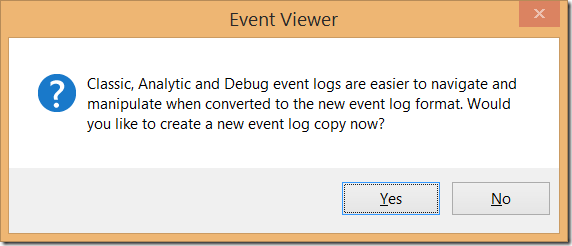
You will notice many events in Event Viewer
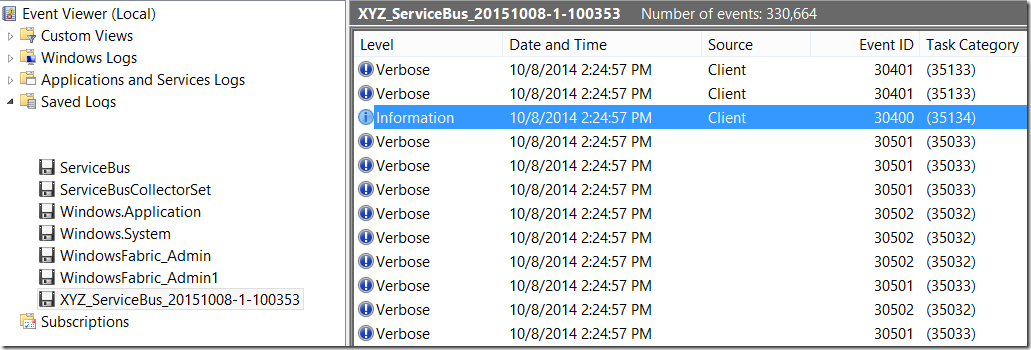
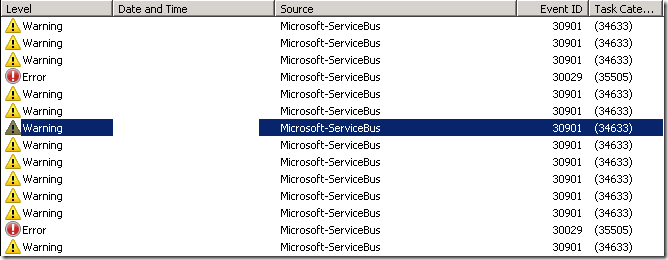
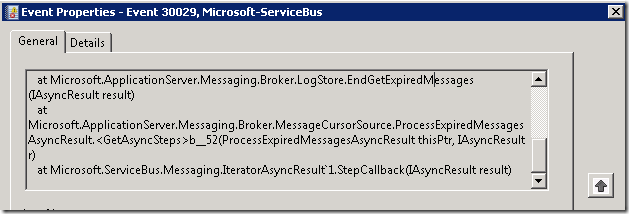
But it can happen, that no information for event is shown at all, when you double-click an event.
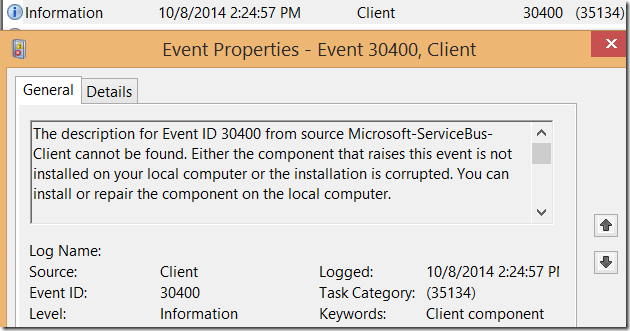
To be able to see full event description, you will have to open the trace file on machine which has
installed Service Bus.
Posted
Oct 21 2014, 07:03 PM
by
Damir Dobric