Machine Learning is probably one of most exiting areas of software development. But honestly, a common software developer has not so much to do with Machine Learning in his daily job. This is because ML is traditionally a research task and not a development task. It is in its nature hard job to find the right learning model. This task usually takes a months or even years. And even when it is finished it is typically done with tools, which focus research area and not practically widely used runtimes like .NET, JAVA, etc. This should be changed with Azure ML.
When we talk about learning we often mean different things. To make this clear let’s set up the learning context first. Machine Learning in context of software developer can be defined by two tasks/goals:
1. Finding patterns and behaviors in data.
2. Replacing human written code with supplying data.
Finding of patterns and behaviors means data analysis. This is usually self explaining. More confusing is second part related to replacing of the code, because this is something we developer find still impossible. ML is truly about this if you believe or not.
Here is why. Imagine you are building a software which has to decide which coin you inserted in some automat. Assume this automate delivers as output the weight of the coin as only output value. Your task is to recognize the coin by its weight. So, you will write the code like this:
public string Get Coin(){
var weight = deviceApi.GetCoinWeight();
if(weight >= 25.000 && weight <= 27.00)
return “1 cent”;
else if(weight >= 35.000 && weight <= 35.00)
return “10 cent”;
}
Mathematically you are writing the function coin =f (weight). To be able to write it you will first take many of coins of all types (1ct, 5ct, 10ct,..) and measure the weight of them. After some time YOU (not software) will figure out weight ranges with appropriate tolerance. What you did, you trained your brain which learned to make a difference between coins. And finally you implemented the method GetCoin which includes your learned experience. Imagine after some time government decides to change coins and they become slightly different weights. In this case your method GetCoin wouldn’t work anymore. So, you will have to learn (measure) new coins and apply new values to your code. In fact you would change the code.
ML approach is exactly about this. We want to build the method GetCoin which will have a code, which will not change when government decide to change coins. The written code must be able to adopt itself after new weights of new coins are applied to system.
In my opinion this is exactly a momentum when one software developer starts to be skeptic. I’m sure, you don’t believe me that this is possible  . But, it is!!
The solution is to write a code which is changing (adopting) itself when the environment (input variables – typically called features' – in our example weight) change. Is this not expectation of artificial intelligence?
Usually your code in this case will not be source code with some decision threes. This is what make developers skeptic. You will rather build some strange mathematical function (not the code) with many internal variables which will work in two modes:
1. Training Mode
2. Execution Mode
In training mode you will in our sample enter the weight for every of coin samples and provide s result. For example 25.66g is 1Ct. etc. Each time you enter new weight and apply to it the function will recalculate its internal state. The longer training process the better function result. At some point internally your function will be so tuned that entering of more and more inputs ideally wouldn’t cause any change of function. In this case the system is trained.
The process of training and applying the correct value during the training, must obviously be implemented by code. This is where ML comes in to play. This part and much more is already fully implemented.
This is some kin of web based IDE (environment) which helps you chose different training models.
But let’s start with a hello world example for Machine Learning.
Open the azure portal, select Machine Learning and click on “quick-create”.
![image_thumb[3]](http://developers.de/cfs-file.ashx/__key/CommunityServer.Blogs.Components.WeblogFiles/damir_5F00_dobric/image_5F00_thumb3_5F00_thumb_5F00_18DAA08D.png "image_thumb[3]")

This was not very spectacular. After that click on “Open in Studio”. This will bring you to the next “portal”, where you can do much more.
![image6_thumb[1]](http://developers.de/cfs-file.ashx/__key/CommunityServer.Blogs.Components.WeblogFiles/damir_5F00_dobric/image6_5F00_thumb1_5F00_thumb_5F00_41E53F89.png "image6_thumb[1]")
At this point you can start a ne fresh project or chose one existing sample. Projects in the world of ML are called experiments. I will chose now a new experiment (project).
![image91_thumb[1]](http://developers.de/cfs-file.ashx/__key/CommunityServer.Blogs.Components.WeblogFiles/damir_5F00_dobric/image91_5F00_thumb1_5F00_thumb_5F00_0142F31A.png "image91_thumb[1]")
I would highly recommend to take a look on existing samples. Right now there are 26 samples which demonstrate how to solve different kind of problems. Here is the screenshot of all of them.


After you have created a new experiment you will get an empty experiment space. The picture below shows the all you need to do in a simple experiment. In this space you can visual model you experiment. There are many different shapes (actions), which help to solve specific problems. Here you can chose the data, you can manipulate the data, you can analyze it, chose and tune the algorithm etc., etc. The very first shape is always the definition of data source which will be used in experiment.
In next topics we will describe how to do that.
![image_thumb[5]](http://developers.de/cfs-file.ashx/__key/CommunityServer.Blogs.Components.WeblogFiles/damir_5F00_dobric/image_5F00_thumb5_5F00_thumb_5F00_22C4B35A.png "image_thumb[5]")
Working with Data Sets
Before you start with experiment it is typically required to find the data which will be used. Independent on how the data is collected it must be stored in some specific format on some specific place.
Data used in experiment is called dataset. ML helps working with several locations of data and several formats.
Commonly we can use an existing dataset or we can provide our own data, which is more realistic case.
In this article we will use an existing dataset, provided by ML team.
To chose the dataset, simply tap on “Saved Datasets” and peek source which you want to use. For this experiment I will peek “Adult Census Income Binary Classification dataset”.

I will drag it to the model and get something like this:
![image_thumb[11]](http://developers.de/cfs-file.ashx/__key/CommunityServer.Blogs.Components.WeblogFiles/damir_5F00_dobric/image_5F00_thumb11_5F00_thumb_5F00_124C425F.png "image_thumb[11]")
As next I can analyze the data in the dataset by clicking on a circle on the bottom side of the stencil:
![image_thumb[12]](http://developers.de/cfs-file.ashx/__key/CommunityServer.Blogs.Components.WeblogFiles/damir_5F00_dobric/image_5F00_thumb12_5F00_thumb_5F00_18FF4BE2.png "image_thumb[12]")
Following picture shows all columns and rows of the dataset. The last column on the right side is the column which we will try to predict. In fact we will try to predict “income” (also called label) from other columns called features.
![image21_thumb[1]](http://developers.de/cfs-file.ashx/__key/CommunityServer.Blogs.Components.WeblogFiles/damir_5F00_dobric/image21_5F00_thumb1_5F00_thumb_5F00_69443413.png "image21_thumb[1]")
So, our task in this experiment is to model the function f, which can be described as:
income = f (age, workclass,..nativecountry)
We train the system with approx. 30000 rows (see on top left – picture above).
Statistics and Visualizations
On the right side of the picture above we can embed statistics and visualizations for columns.
For example, select a column “education”. Under statistics (cut on picture on top right) you can notice 16 different values (categories of education). Value of category is of type string and all rows contains the value for this column.
Most of rows 10000+ are of education category “HS-grad”, the 7000+rows are of education type “some college” etc.
![image_thumb[23]](http://developers.de/cfs-file.ashx/__key/CommunityServer.Blogs.Components.WeblogFiles/damir_5F00_dobric/image_5F00_thumb23_5F00_thumb_5F00_28A1E7A4.png "image_thumb[23]")
Similarly we can select the column “race”:
![image_thumb[25]](http://developers.de/cfs-file.ashx/__key/CommunityServer.Blogs.Components.WeblogFiles/damir_5F00_dobric/image_5F00_thumb25_5F00_thumb_5F00_63F54D62.png "image_thumb[25]")
We see that we have a data for 5 different races and white is race with most available data.
Min and Max
Depending on data in the column things can get much more interesting. Let’s select some column now which is not categorical like “age”. It is of numeric type. In this case we have statistical data.
Minimum age is in this case 17 and maximum age is 90. You can see in histogram below, that most data are available from age 17-46. This is obviously the age in US with most jobs?! I’m asking myself, why don’t we has so much employees with ages higher than 46? IS that reality or our data is not 100% realistic? Whatever the answer is, it is a good example of how you can analyze the data, before you start with Machine Training.
Mean
The arithmetic mean (or simply "mean") of a sample  , usually denoted by
  , is the sum of the sampled values divided by the number of items in the sample:
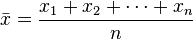
More on mean value you can find in Wikipedia (at least) http://en.wikipedia.org/wiki/Mean.
Median
the median is the numerical value separating the higher half of a data from the lower half. For example the median of set {3, 3, 5, 9, 11} is 5. We simply sort all values and the the middle one. If there is an even number of value in set, then there is no single value in the middle.
In this case median is usually defined to be the mean of the two middle values. For example median {3, 5, 7, 9} is 6, because the mean of two middle values 5 and 7 is (5 + 7) / 2 = 6. In our case this is 37.
Unique Values
We have 73 unique values in samples
Standard Deviation
For a finite set of numbers, the standard deviation is found by taking the square root of the average of the squared differences of the values from their average value.
For more information about standard deviation take a look here: http://en.wikipedia.org/wiki/Bounded_variation.
![image_thumb[27]](http://developers.de/cfs-file.ashx/__key/CommunityServer.Blogs.Components.WeblogFiles/damir_5F00_dobric/image_5F00_thumb27_5F00_thumb_5F00_53E90F5C.png "image_thumb[27]")
![image_thumb[28]](http://developers.de/cfs-file.ashx/__key/CommunityServer.Blogs.Components.WeblogFiles/damir_5F00_dobric/image_5F00_thumb28_5F00_thumb_5F00_686E5EDA.png "image_thumb[28]")
How to create a custom data set?
To create a custom dataset click on new, but this time chose dataset instead of experiment.
![image_thumb[15]](http://developers.de/cfs-file.ashx/__key/CommunityServer.Blogs.Components.WeblogFiles/damir_5F00_dobric/image_5F00_thumb15_5F00_thumb_5F00_4F065BA0.png "image_thumb[15]")
We can chose several formats of files, which can be uploaded.
![image_thumb[17]](http://developers.de/cfs-file.ashx/__key/CommunityServer.Blogs.Components.WeblogFiles/damir_5F00_dobric/image_5F00_thumb17_5F00_thumb_5F00_43709E61.png "image_thumb[17]")
I designed my dataset as follows, and saved it to some local folder:
f1 f2 f3 f4 label
1.1 1.2 1.3 1.4 TRUE
2.1 2.2 2.3 2.4 FALSE
1.1 1.2 1.3 1.4 TRUE
1.1 1.2 1.3 1.4 TRUE
4.1 2.2 5.3 2.4 FALSE
5.1 2.2 3.3 2.4 FALSE
. . .
The I create a new dataset and select the file in folder:
![image_thumb[19]](http://developers.de/cfs-file.ashx/__key/CommunityServer.Blogs.Components.WeblogFiles/damir_5F00_dobric/image_5F00_thumb19_5F00_thumb_5F00_70F1BE24.png "image_thumb[19]")
After few seconds (depends on amount of data) the new dataset will appear in the list of data sets:
![image_thumb[32]](http://developers.de/cfs-file.ashx/__key/CommunityServer.Blogs.Components.WeblogFiles/damir_5F00_dobric/image_5F00_thumb32_5F00_thumb_5F00_3364605B.png "image_thumb[32]")
Observing the Data from external sources
If the data exists already on some external location which is publicly accessible, we can observe it by using the reader. Right now, data can be consumed from Web URL via simple HTTP-GET in different formats like CSV, TSV, ARFF and SVMLIGHT, then from SQL DB, Azure Table Storage, Blob Storage or Data Feed.
More information about this: http://help.azureml.net/Content/html/4e1b0fe6-aded-4b3f-a36f-39b8862b9004.htm
![image_thumb[34]](http://developers.de/cfs-file.ashx/__key/CommunityServer.Blogs.Components.WeblogFiles/damir_5F00_dobric/image_5F00_thumb34_5F00_thumb_5F00_01008CDC.png "image_thumb[34]")
![image_thumb[35]](http://developers.de/cfs-file.ashx/__key/CommunityServer.Blogs.Components.WeblogFiles/damir_5F00_dobric/image_5F00_thumb35_5F00_thumb_5F00_39AB36E9.png "image_thumb[35]")
In the next part we will focus on training of the model.
Episode II: http://developers.de/blogs/damir_dobric/archive/2014/12/23/azure-machine-learning-episode-1.aspx
Posted
Dec 23 2014, 12:08 PM
by
Damir Dobric