When starting with Machine Learning, there are couple of "Hello World" template algorithms that helps beginner understand how basic concepts of ML work. Linear Regression is one of them. In this blogpost we are going to see how to write a linear regression program in Python.
As a beginner you should still know the basics of python and python libraries such as numpy, matplotlib, pandas etc., as we are going to use these libraries for writing our algorithm.
First, let's start with an example. We have here a dataset, that looks like following -
age,speed
5,99
7,86
8,87
7,88
2,111
17,86
2,103
9,87
4,94
11,78
12,77
9,85
6,86
This data is in a csv file called - cardata.csv. Each row of the dataset represents a car. In age column, we have the age of the car, i.e. how old the car is. Under speed column, we have avg. high speed this car can achieve. As it is visible from data, car that is not so old, e.g. age 2 Years, has higher avg. high speed, and car that is older, has lower avg. high speed. Our task is for algorithm to predict the avg. speed of the car based on it's age.
To do that, let's create a new python class - regression.py.
We import numpy, pyplot (For plotting the result), pandas (For reading the data from csv file, and scipy for doing the linear regression.
import numpy as np
import matplotlib.pyplot  as plot
import pandas as pa
from scipy import stats
Then we read the csv values in a variable, and write the feature (that is age of the cars), and labels (i.e. avg. high speed of the car) in two separate variables -
pd = pa.read_csv("regression.csv")
features = pd["age"]
labels = pd["speed"]
Now use stats library from scipy to calculate the linear regression.
slope, intercept, r, p, std_err = stats.linregress(features, labels)
linregress method calculates slope, intercept, correlation cofficient, p-value, and standard error. Using the slope from this, we now calculate line function with the formula - Y = mX + c; where m is slope and c is constant which in our case is intercept.
def lineFunc(x):
  return slope * x + intercept
Now using this line function, we can plot a line classifying our dataset.
lineY = list(map(lineFunc, features))
print(lineY)

plot.scatter(features,labels)
plot.plot(features,lineY)
plot.show()
Which looks like this -
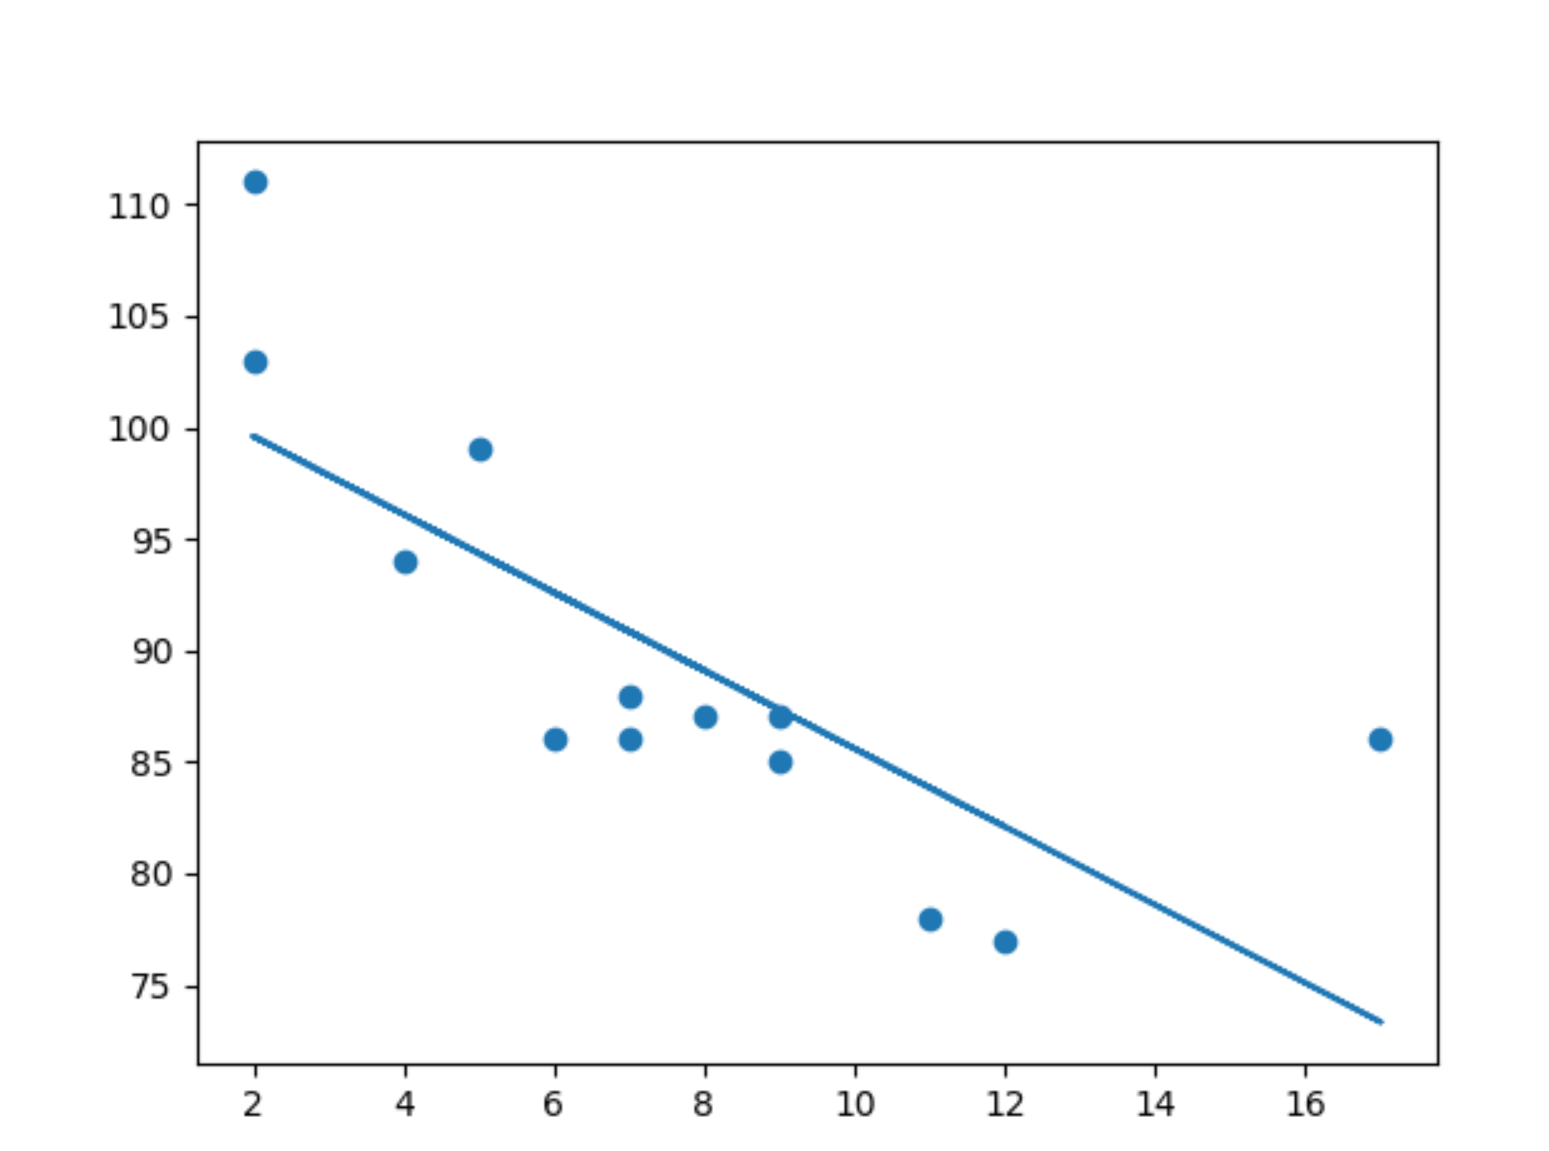
By looking at this graph we can see the line is pretty much reflecting the data. Now let's use this to predict speed of a car which is 6 years old -
speedY = lineFunc(6)
print(speedY)

result -
92.59823399558499
And that is basically all of it. :)
You can find the complete code on my GitHub Repo